Original Article - DOI:10.33594/000000619
Accepted 17 January 2023 - Published online 7 April 2023
1Water and Hydration Translational Epidemiological Research, San Francisco, USA;
2Department of Internal Medicine, St. Johanns University Hospital, Paracelsus Medical University, Salzburg, Austria;
3Department of Laboratory Medicine, Paracelsus Medical University, Salzburg, Austria;
4Department of Physiology, Eberhard Karls University, Tuebingen, Germany;
5Clinic for Gastroenterology, Hepatology, and Infectious Diseases, Medical Faculty, Heinrich Heine University Düsseldorf, Düsseldorf, Germany;
6Office of Research, University of California, San Francisco, USA;
7Division of Hematology, Department of Pediatrics, RBC Lab, University of California, San Francisco, USA;
8Center of Physiology, Pathophysiology and Biophysics, Institute of Physiology and Pathophysiology, Salzburg, Austria;
9Ludwig Boltzmann Institute for Arthritis and Rehabilitation, Paracelsus Medical University, Salzburg, Austria;
10Gastein Research Institute, Paracelsus Medical University, Salzburg, Austria;
11Kathmandu University School of Medical Sciences, Dhulikhel, Nepal
Background/Aims: Cells adapt to chronic extracellular hypotonicity by altering metabolism. Corresponding effects of sustained hypotonic exposure at the whole-person level remain to be confirmed and characterized in clinical and population-based studies. This analysis aimed to 1) describe changes in urine and serum metabolomic profiles associated with four weeks of sustained >+1 L/d drinking water in healthy, normal weight, young men, 2) identify metabolic pathways potentially impacted by chronic hypotonicity, and 3) explore if effects of chronic hypotonicity differ by type of specimen and/or acute hydration condition. Materials: Untargeted metabolomic assays were completed for specimen stored from Week 1 and Week 6 of the Adapt Study for four men (20-25 years) who changed hydration classification during that period. Each week, first-morning urine was collected after overnight food and water restriction, and urine (t+60 min) and serum (t+90 min) were collected after a 750 mL bolus of drinking water. Metaboanalyst 5.0 was used to compare metabolomic profiles. Results: In association with four weeks of >+1 L/d drinking water, urine osmolality decreased below 800 mOsm/kg H2O and saliva osmolality decreased below 100 mOsm/kg H2O. Between Week 1 and Week 6, 325 of 562 metabolic features in serum changed by 2-fold or more relative to creatinine. Based on hypergeometric test p-value <0.05 or Kyoto Encyclopedia of Genes and Genomes (KEGG) pathway impact factor >0.2, the sustained >+1 L/d of drinking water was associated with concurrent changes in carbohydrate, protein, lipid, and micronutrient metabolism, a metabolomic pattern of carbohydrate oxidation via the tricarboxylic acid (TCA) cycle, instead of glycolysis to lactate, and a reduction of chronic disease risk factors in Week 6. Similar metabolic pathways appeared potentially impacted in urine, but the directions of impact differed by specimen type. Conclusion: In healthy, normal weight, young men with initial total water intake below 2 L/d, sustained >+1 L/d drinking water was associated with profound changes in serum and urine metabolomic profile, which suggested normalization of an aestivation-like metabolic pattern and a switch away from a Warburg-like pattern. Further research is warranted to pursue whole-body effects of chronic hypotonicity that reflect cell-level effects and potential beneficial effects of drinking water on chronic disease risk.
Whole-body hydration translates to cell hydration and vice versa. Drinking water equilibrates throughout the body water pool within two hours [1]. Cell hydration, which is under tight homeostatic control, determines if body water is retained, lost, or produced by metabolism [2-10]. Although cell hydration is well known to strongly modify cell metabolism [4, 5, 11], corresponding relationships at the whole-body level are less well understood. Causal effects of chronic whole-body hydration on metabolic syndrome-related disorders and mortality are hypothesized based on cell hydration effects [12-16], but remain to be confirmed.
Cell hydration and metabolism
Cell hydration is perturbed by manifold osmotic stressors because cells’ plasma membranes are semipermeable to water and solutes. Cells respond to any deviation of the osmotic equilibrium between the intracellular and extracellular space with an obligated flux of water towards the compartment with the higher osmotic activity. The resulting alterations of cell volume, tension of the plasma and organellar membranes, ionic strength, and molecule concentrations elicit mechanotransduction and osmotic sensing which affect a wide range of cell processes and functions, including gene expression [17, 18], cell proliferation, transport, metabolism, autophagy, redox-balance, fluid homeostasis, solute uptake, cell motility and migration, immune function, and programmed cell death [11, 12, 19-34]. Sophisticated regulatory mechanisms precisely adjust cell volume, hydration, and metabolism [11, 29, 35-38].
Hypotonic swelling of hepatocytes promotes anabolic metabolism, including protein and glycogen synthesis. The hypoosmotic inhibition of proteolysis involves integrins as osmosensors and downstream signaling mediated by focal adhesion kinase, the tyrosine kinase c-Src, and the epidermal growth factor receptor and mitogen-activated protein kinases [35, 39, 40].
Hypertonic shrinkage favors catabolic metabolism. Chronic hyperosmotic stress causes cells to adapt in ways “so numerous as to suggest a major alteration in the state of cells” [15]. Adaptive responses favor intracellular accumulation of low molecular weight osmolytes, such as free amino acids, urea, polyols, and methylamines [41]. Adaptive responses are coordinated by tonicity-responsive-enhancer-binding-protein (TonEBP)/nuclear factor of activated T cells 5 (NFAT5)[15, 42-47]. Hyperosmotic phase separations mediate widespread cellular effects, including regulation of transcription [15, 48, 49]. Adapted metabolism remains altered for days after correction of extracellular tonicity [11, 50] and primes cells to respond differently to acute hypoosmotic shock. Cells that have accumulated osmolytes following chronic hyperosmolality release excess osmolytes in response to acute hypoosmotic shock [31].
Hypertonicity, cell metabolism and chronic disease risk
Many cellular or subcellular compensations for chronic extracellular hypertonicity are recognized risk factors for chronic disorders. As shown in various cell types, tissues, organs, and species, effects of prolonged hypertonicity include increased protein breakdown [9, 51], catabolism of branched chain amino acids (BCAA; i.e. valine, leucine and isoleucine) [52], insulin resistance [53-58], sorbitol production [11, 15, 31, 59], serum and glucocorticoid inducible kinase (SGK1) expression [14], increased intracellular accumulation of serine [60, 61], secretion of pro-inflammatory cytokines, including IL-6 and TNF-alpha, and T-cell proliferation [62-64], viral replication [65], as well as vascular and tissue calcification [66]. Hypertonicity decreases flux through the pentose phosphate pathway [67], glycine oxidation [68], and oxidative phosphorylation efficiency [69]. It alters the glutamine-glutamate ratio, upregulates enzymes of the ornithine-urea cycle [70], and generates reactive oxygen species that increase oxidative stress [71], DNA damage [26], and programmed cell death [72-76].
Drought-related aestivation switches metabolism to suppress ATP-expensive pathways, including protein synthesis, and accumulate organic osmolytes of low-molecular weight, including urea, at the expense of muscle protein breakdown [4, 5, 7, 9, 51].
As each response described above predicts increased risk of chronic disease incidence and/or progression [14, 77-88], it is reasonable to hypothesize that the combined pattern of responses may be associated with chronic disease risk. The metabolomic signature of chronic hypertonicity may be associated with the metabolomic signatures of aging [89], obesity, insulin resistance, high blood pressure, dyslipidemia [87, 90], Alzheimer’s disease [91], coronary artery disease [85] and colorectal cancer [92]. Chronic diseases are associated with a Warburg type of metabolic pattern [93], which, like the aestivation pattern, is characterized by increased protein breakdown and aerobic glycolysis as opposed to oxidative phosphorylation.
Gaps in knowledge about effects of whole-body hydration
Despite experiments demonstrating that incubation of cells in a hypotonic milieu alters cell metabolism, it is unknown if a corresponding chronic hypotonic exposure at the whole-body level changes metabolism. Clinical studies in healthy individuals have tested relatively short-term exposures, which do not generalize to free-living conditions of daily life, such as intravenous or desmopressin-induced hypoosmolality vs. hyperosmolality sustained over 17 hours [94, 95]. Given physiological homeostatic mechanisms that excrete excess body water and mitigate against plasma hypotonicity, it is difficult to conceive of a chronic hypotonic exposure at the whole-body level that exactly parallels long-term incubation of cells in hypotonic media. Regular consumption of hypotonic water might only intermittently dilute plasma and swell cells.
The Adapt Study tested effects of four weeks of higher intake (>+1 L/d above baseline) of plain drinking water in healthy young men[96, 97].Weekly fasting blood tests showed that the sustained hypotonic exposure was associated with only a small, 2 mOsm/kg H2O, mean decrease in serum osmolality. The mean urine osmolality was, nevertheless, halved by the exposure, suggesting that the transient and/or minimal hemodilution was enough to swell osmoreceptor cells in the hypothalamus and suppress anti-diuretic hormone (ADH) release and urine concentrating activity. In association with the sustained higher water intake, the Adapt Study observed significant decreases in serum insulin, serum homeostasis model assessment index of insulin resistance (HOMA-IR), saliva cortisol, and urine arginine and glutamic acid [96, 97]. Though the results signal potential for an array of metabolic changes, prior analyses did not check for a broad array of metabolic effects [96, 97].
Beyond the problem of how to operationalize chronic hypotonicity as an exposure in clinical studies, it also remains to be determined if metabolic effects of chronic hypotonicity can be detected in urine or serum, and under what conditions. While osmotic stress effects are reported in cells from many body tissues, including the intestine [98], kidney [99], brain [100], liver [101], blood [102], vascular endothelium [103], fibroblasts [104], and muscle [105], the effects may be tissue-specific and depend on the presence of particular conditions or substrate [41, 104, 106]. Metabolomic profiles vary by specimen type [107].
To address gaps in knowledge about the effects of chronic whole-body hydration on metabolism, the present analysis revisited Adapt Study data to examine if chronic hypotonicity, induced by four weeks of sustained higher intake (>+1 L/d) of plain water, was associated with a major alteration in metabolism for the participants, akin to a switch in macronutrient and energy metabolism, redox balance, and inflammation, detectable in serum or urine. The analysis described changes in the serum and urine metabolomic profiles associated with chronic hypotonicity, and metabolic pathways potentially impacted by the changes. The analysis considered if and how results depended on specimen type (urine vs. serum) and condition (after overnight food and fluid restriction vs. 60 min after drinking a bolus of 750 mL water).
Study design & population
This secondary analysis used data from Week 1 and Week 6 of the Adapt study [96, 97]. Participation in the Adapt study involved a baseline period, followed by instruction to increase plain water intake by +1 L/d above baseline in Weeks 3 and 4 and increase plain water intake to +2 L/d above baseline in Weeks 5 and 6.
All Adapt study participants (n=5) were healthy men, aged 20–25 years, with sedentary physical activity level, normal weight status, and 3-day mean total water intake below 2 L/day before enrollment. They were non-smokers and infrequent consumers of caffeinated or alcoholic beverages (less than 2 servings/week). For the duration of the study, the participants were instructed to record the type and estimated portion size of all foods and drinks consumed, using 7-day diet records, and consume the same foods and beverages, as consumed at baseline, on a weekly cycle. They were instructed to maintain their baseline level of physical activity and wear an armband to monitor their physical activity (SenseWear Pro 3, BodyMedia, Pittsburg, PA, USA). Total energy and macronutrient intake and physical activity did not change significantly over time [96].
The present analysis focused on study participants who changed hydration classification. Between Week 1 and Week 6, urine osmolality decreased below 800 mOsm/kg H2O, saliva osmolality decreased below 100 mOsm/kg H2O, and serum osmolality remained below 295 mOsm/kg H2O. Urine osmolality of 800 mOsm/kg H2O or higher is frequently interpreted as suboptimal hydration, underhydration, or index of hyperosmotic stress on cells (cell dehydration) [108-112]. Saliva osmolality above 100 mOsm/kg H2O approximately corresponds with a total body water (TBW) deficit greater than 1% [113, 114]. Serum osmolality of 295 mOsm/kg H2O or higher is recognized as elevated [115, 116].
The present analysis excluded one of the five Adapt study participants who did not meet all three hydration criteria in Week 6. Each of the remaining four participants transitioned from not meeting one or more hydration criteria in Week 1 to meeting all three criteria in Week 6.
Specimen collection & processing
In Week 1 and Week 6, the study participants came to the research clinic in the morning after overnight food and water restriction for specimen collection and clinical measures. At home, the study participants collected first-morning urine in a pre-labeled container. They arrived at the clinic with the first-morning sample in a cooler with an ice pack at approximately 8 am. Fasting body weight was measured in duplicate using a calibrated clinical scale (Scale-Tronix, Carol Stream, Illinois, USA) after the participants voided and removed shoes and outer clothing. TBW was estimated from body weight using the Watson and Hume equations [117, 118].
The study participants collected unstimulated saliva by passively drooling through a straw after a few moments of not swallowing. Participants were next given 750 mL plain tap water to consume within approximately five to ten minutes. Urine was collected within 60 minutes after the water bolus. Blood was collected 90 minutes after the bolus into non-anticoagulated tubes.
Urine, saliva, and serum osmolality were determined in triplicate on fresh samples by freezing point depression osmometer (Advanced Instruments Model 3320, Norwood MA, USA). Freshly collected whole blood was used to determine the red blood cell (RBC) mean corpuscular volume (MCV) from manual hematocrit (HCT) and RBC concentration: MCV (fL) = HCT x 10/RBC concentration. The manual spun HCT (in %) was determined in triplicate and the RBC concentration (in millions/µL) was determined by the ADVIA 120 hematology analyzer (Bayer Healthcare, Tarrytown, NY, USA) at Children’s Hospital Oakland Research Institute (CHORI) (Oakland, CA, USA).
RBC deformability was also determined on fresh whole blood at CHORI (Oakland, CA, USA) by ektacytometry. Briefly, whole blood was suspended in a viscometer and exposed to shear stress in solutions ranging in osmolality from hypotonic to hypertonic by a NaCl gradient in polyvinylpyrrolidone (PVP) at a viscosity of 30 cP. On the hypotonic part of the range, the osmolality associated with minimal RBC deformability was determined. On the hypertonic part of the range, the osmolality where RBC deformability is half of maximal deformability was determined [119].
Aliquots of first-morning urine, post-bolus urine, serum, plasma, and white blood cells (WBC) were stored frozen at -80°C. Stored WBC were sent to TruDiagnostic (Lexington KY, USA) for determination of the DunedinPACE index of aging [120].
Stored plasma was sent to the Victoria Hospital Kidney Clinical Research Unit, London ON, Canada, for determination of plasma copeptin by automated immunofluorescent assay. Serum creatinine (mg/dL) was determined by Quest Diagnostics (San Jose, CA, USA). The glomerular filtration rate was estimated using the Chronic Kidney Disease Epidemiology Collaboration (CKD-EPI) creatinine equation [121].
The RBC K:Na ratio, a proxy reflecting Na-K pump activity, was determined at CHORI as described previously. Briefly, heparinized whole blood was centrifuged, RBC pellets were washed in choline, lysed and digested in OmniTrace 70% HNO3 (EMD Chemicals) overnight (60°C, 150–200 rpm orbital shaking), and thereafter diluted to 5% HNO3 with OmniTrace water (EMD Chemicals, Gibbstown, NJ, USA). The acid lysates were centrifuged (10 min at 3000 x g) and introduced into a Vista Pro inductively coupled plasma – atomic emission spectrometer (ICP-AES; Varian Inc., Palo Alto, CA, USA) as described previously [122]. The ICP-AES was calibrated using National Institute of Standards and Technology (NIST)-traceable elemental standards and validated using NIST-traceable 1577b bovine liver reference material (BLRM). Na and K were determined at 568.821 nm and 766.491 nm, respectively. The detection range was 0.05–50 ppm. The coefficient of variations (CV) for intra-assay and inter-assay precision for elements measured with the NIST reference material were routinely <10%. Cesium (50 ppm) was used for ionization suppression and yttrium (5 ppm) was used as an internal standard for all samples. All reagents and plastic ware were certified or routinely tested for trace metal work. Elemental content data was summarized using native software (ICP Expert; Varian Inc.) and normalized to RBC volume determined by complete blood count (CBC).
Body water turnover was indexed using the 7-day deuterium elimination rate method. Once in each two-week study period, the 750 mL water bolus administered to the study participants contained 10 mL 2H2O (99.9 atom%, Donated from the Western Human Nutrition Research Center, UC Davis, CA, USA). The deuterium enrichment (D/H) was determined by mass spectrometry for one urine or plasma sample collected before each dose, one sample collected at least 90 min after each dose, and one sample collected 7 days after each dose. The D/H measurement was made directly in urine, but water from plasma was partially purified before analysis by centrifugation (30 min at 3, 000 x g, Amicon ultra 15, 10 kDa, NMWL, Millipore, Billerica, MA, USA). The D/H was analyzed on a Micromass Isoprime DI coupled with an Aquaprep system (Isoprime Ltd, Cheadle Hulme, UK) using the H2-water equilibration method in the presence of hydrophobic platinum as the catalyst (Horita and Kendall 2004) as previously described [1]. The analyses were performed at the Laboratoire de Géochimie des isotopes stables (Centre GEOTOP-UQAM, Montréal, Canada). The D/H was expressed in ppm versus V-SMOW (155.76 ppm): D/H (ppm) = [(D/H in delta V-SMOW/1, 000) + 1] x 155.76. The half-life of D2O in the body (t ½ in days) was estimated to index the turnover of the body water pool as [ln 2]/-kr, where kr is the deuterium elimination rate (Δ ln (D/H, ppm)/days), the rate constant of D2O disappearance from the body water pool [1]. As the exact weight of the 10 mL 2H2O dose was not recorded, it was not possible to reliably estimate the TBW.
Metabolomic analysis
Metabolomics analysis provides global assessment of low molecular weight metabolites, including sugars, lipids, steroids, vitamins, amino acids, fatty acids, organic acids, and small peptides, in biological samples, which reflect the downstream expression of genome, transcriptome, proteome, and phenotype of an organism, at a point in time, given exogenous factors, such as physical environment, time of day, and diet [107].
First-morning urine, post-bolus urine, and serum specimen were sent to the University of California Davis, West Coast Metabolomics Center (WCMC) for untargeted analysis of primary metabolism using validated automated liner exchange, cold injection system, gas chromatography with time-of-flight mass spectrometry (ALEX-CIS GCTOF MS). The WCMC uses 15-25 internal standards, a standardized protocol for removing noise from raw data, and a BinBase algorithm to match spectra with known compounds [123]. All specimen, first-morning urine, post-bolus urine, and serum from all time points, were analyzed in one batch. WCMC reported the peak height (mass-to-charge ratio, m/z) and peak retention times (rt; in seconds) for all features that were positively detected in at least 10% of the urine and serum samples. Known compounds were reported with their Kyoto Encyclopedia of Genes and Genomes (KEGG) ID.
Data analyses
MetaboAnalyst 5.0 software [124, 125] was used to normalize and analyze the metabolomic data. Feature peak heights from all three specimen types were normalized relative to creatinine (KEGG ID C00791, m/z/rt: 115/502599) to account for the known decreases in serum and urine osmolality between Week 1 and Week 6 [96]. Serum creatinine did not change significantly between Week 1 and Week 6. To include report of the physiological conditions experienced without control for hemodilution, serum metabolomic data were also analyzed, normalized relative to the pooled Week 1 sample. For all MetaboAnalyst analyses, in addition to normalization, the data were log transformed, mean-centered, and divided by the standard deviation of each variable to facilitate comparison of features.
Specific Aim 1: Describe change in metabolomic profiles associated with induced chronic hydration
To check for evidence of a major alteration in metabolism, the serum and urine metabolomic profiles were considered in terms of the number and percent of metabolic features altered, significant change in the overall profile, and number of metabolic pathways altered. Given that serum is considered a reasonably good metabolic proxy for the entire organism [107], analyses focused on change in the serum metabolomic profile relative to creatinine to check for altered whole body metabolism. The same analyses were repeated for each specimen type.
Change in feature abundance was expressed in terms of fold change from Week 1 to Week 6. The fold change of all metabolic features studied was summarized in a plot of log fold change. The number and percent of features that changed by 2-fold or more in abundance for three or more study participants were determined.
Change in the overall metabolomic profile was visualized using heatmaps, Orthogonal Partial Least Squares Discriminant Analysis (OPLS-DA) 2-D score plots, and Principal Components Analysis (PCA) score plots. Each participant’s time point-specific metabolomic profile was represented as a column in a heatmap, point in OPLS-DA score plot, and point in PCA score plot. OPLS-DA is designed to distinguish within- and between-group variation, taking into account specified factors (time, in the present analysis) [126]. Statistically significant differences in metabolomic profile between Week 1 and Week 6 were defined in terms of non-overlapping 95% confidence regions on the OPLS-DA and PCA score plots [127]. PCA is an unsupervised method for distinguishing class differences in data, without specifying class factors in advance. Both OPLS-DA and PCA were used because OPLS-DA results can be statistically unreliable without PCA cross-validation, and PCA results can miss important factors [128, 129].
To check if multiple metabolic pathways were potentially impacted by the induced change in hydration between Week 1 and Week 6, KEGG IDs for known compounds that changed by 2-fold or more for at least three participants were uploaded to the Pathways module of MetaboAnalyst 5.0. Compounds that decreased were entered separately from compounds that increased to facilitate interpretation about the direction of potential change in the pathway. Using the Homo sapiens library as reference, the hypergeometric test was used to test if the specified group of compounds was overrepresented, i.e. occurred more frequently than would be expected by chance. In addition to p-value and p-value adjusted for multiple testing using False Discovery Rate (FDR), the software reports an index of pathway impact, which is calculated by adding up the centrality and enrichment measures of each of the matched metabolites and then dividing by the sum of the measures of all metabolites in the pathway. The analysis highlighted pathways where a statistically significant (raw p-value <0.05) number of intermediates were impacted or where the impacted intermediate(s) was central or important to the pathway (impact factor >0.20).
Specific Aim 2: Describe metabolic pathways potentially impacted by the induced change in hydration
Metabolic pathways identified as potentially impacted, based on the serum metabolomic results, were grouped by type of pathway and direction of change. Pathways were grouped by involvement in protein metabolism, carbohydrate metabolism, lipid metabolism, redox balance, or inflammation. The potential impacts were summarized in relation to the TCA cycle.
To check for a switch in energy metabolism, we described coordinated changes in multiple pathways resulting in concurrent changes in TCA cycle precursors. Given the hypotonic exposure, a metabolic switch away from protein breakdown was hypothesized. Given the association between chronic diseases and the Warburg-like metabolic pattern, oxidative glycolysis via the TCA cycle (also known as oxidative phosphorylation) was distinguished from glycolysis to lactate.
Specific Aim 3: Compare results derived from different specimen
To check if metabolomic effects of hydration depend on the type of specimen assayed, the agreement in results from different specimen was described: serum vs. urine, first-morning urine vs. post-bolus urine, and serum normalized relative to creatinine vs. serum relative to the pooled Week 1 sample. Agreement was described in terms of overall change in metabolomic profile, known compounds that changed by 2-fold or more, which metabolic pathways appeared potentially impacted, and direction of potential impact.
Participant characteristicsFour healthy, normal weight men (ages 21-25 years) were included in this analysis. They maintained a total energy intake of approximately 2,000 kcal/d and did not significantly change their physical activity level over the study weeks. The four participants significantly increased plain water intake between Week 1 and Week 6. The increase in drinking water was associated with a decrease in other beverage intake of about 1 serving/d, but no significant change in total macronutrient or energy intake.
Between Week 1 and Week 6, the four study participants included in this analysis experienced a change in hydration classification (see Table 1). In Week 1, all four participants had a urine osmolality above 800 mOsm/kg H2O. Two of the four participants had saliva osmolality over 100 mOsm/kg H2O. In Week 6, all four participants had urine osmolality below 800 mOsm/kg H2O, saliva osmolality below 100 mOsm/kg H2O, and serum osmolality below 295 mOsm/kg H2O.
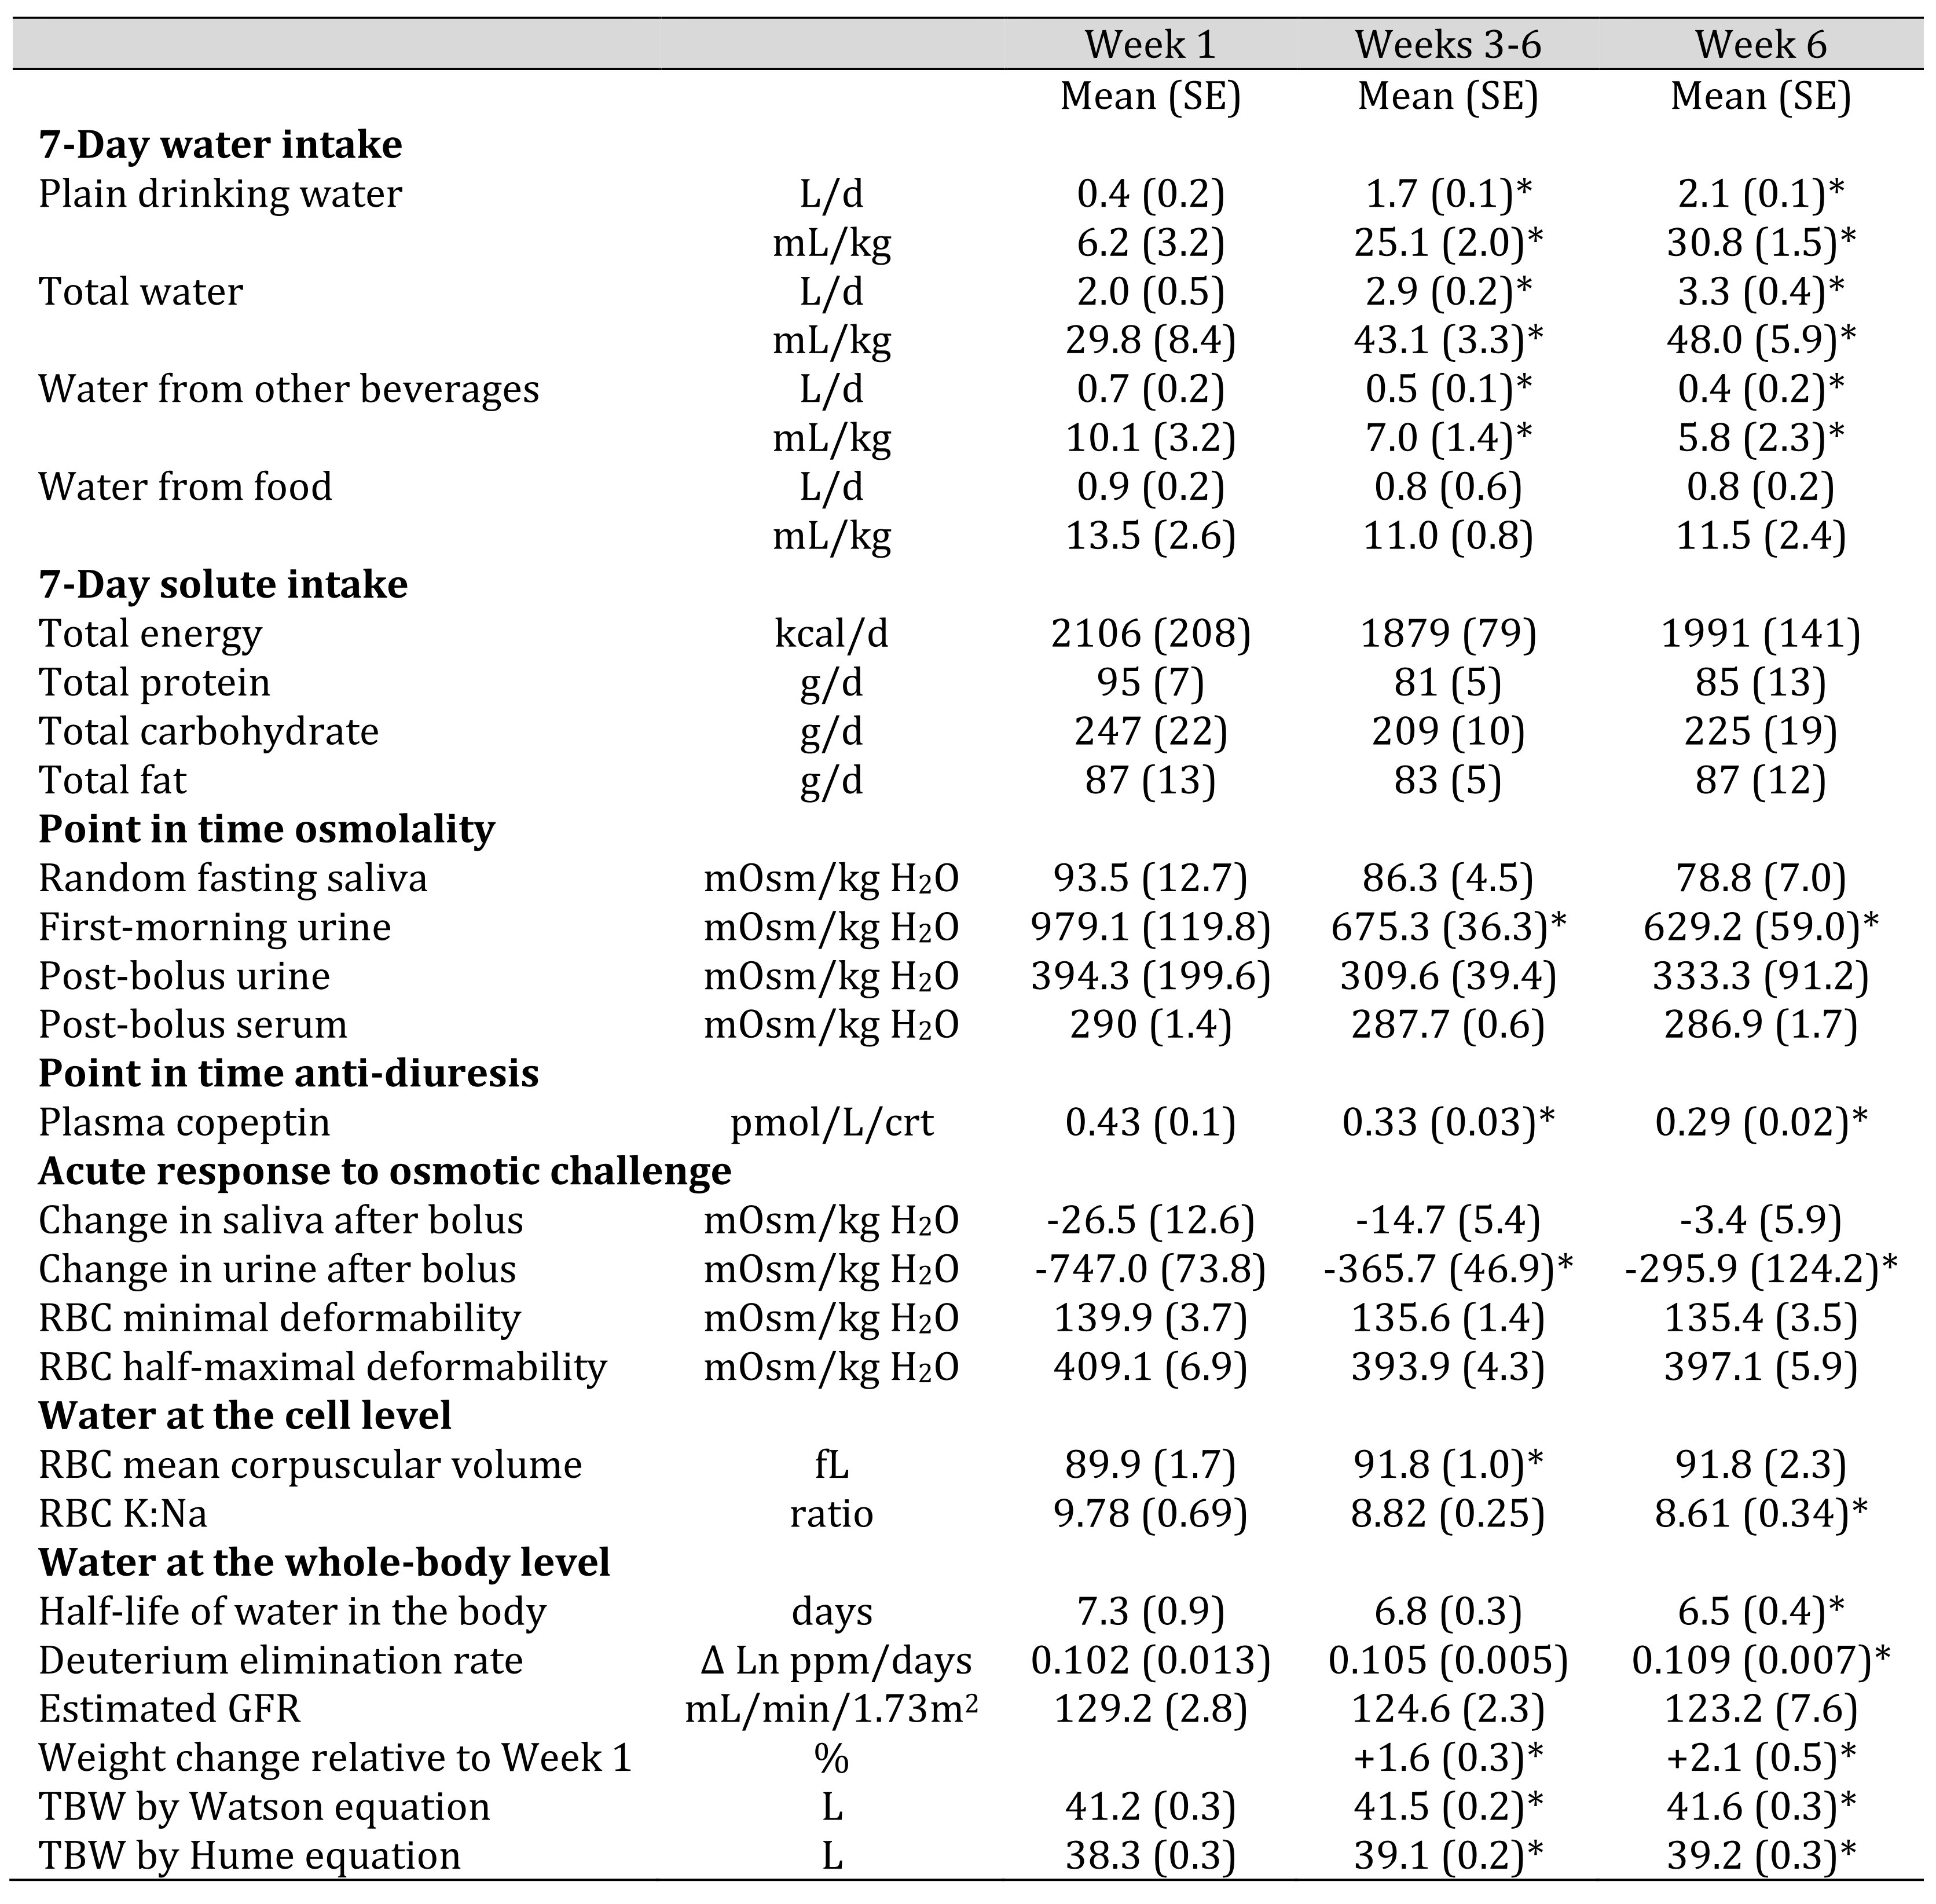
Table 1. Characteristics of Adapt study participants who changed hydration classification between Week 1 and Week 6. The table describes four study participants. Mean (± SE) weekly nutrient intakes were estimated from 7-day diet records collected over six consecutive weeks. Post-bolus samples were collected 60-90 min after the participants consumed 750 mL drinking water. Table 1 presents indices of cell water or total body water that were available in the Adapt study database. For detail about the methods see [96, 97]. *Significantly different (p<0.05) from corresponding Week 1 value in fixed effect regression models.
The sustained increase in water intake was associated with significantly decreased plasma copeptin and urine osmolality, over four weeks, and significantly greater red blood cell volume, deuterium elimination rate (shorter half-life of water in the body), estimated total body water, and body weight in Week 6 relative to Week 1.
In Week 1, the average decrease in urine osmolality following acute hypotonic challenge exceeded 700 mOsm/kg H2O. The response to acute challenge decreased significantly between Week 1 and Week 6, suggesting greater retention of the 750 mL water bolus, following overnight food and water restriction, in Week 6. Other responses to acute osmotic challenge suggested a trend towards greater tolerance of hypotonicity in Week 6 but did not reach statistical significance. In Week 6, the mean decrease in saliva osmolality following the water bolus was about one tenth the decrease observed in Week 1. The osmolality associated with half-maximal RBC deformability was about 10 mOsm/kg H2O lower in Week 6.
Significant changes in serum chemistry and indirect calorimetry signaled change in macronutrient and energy metabolism for the four study participants between Week 1 and Week 6. The fasting serum total protein and albumin decreased, while serum glucose increased. The fasting, recumbent respiratory quotient was significantly higher in Week 6 compared to Week 1 (see supplementary Table S1).
A downward trend in the HOMA index and significant mean (SE) decrease in the DunedinPACE index of 0.027 (0.008) further signaled reduced age-related chronic disease risk between Week 1 and Week 6.
Specific Aim 1: Check for a major alteration in metabolism
Metabolomic analysis identified a total of 562 features in serum, including 168 known compounds. From Week 1 to Week 6, the majority of features changed in abundance by 2-fold or more, relative to creatinine, for at least three of the four study participants. A total of 78 features decreased and 247 increased (supplementary Figure S1).
The Week 1 and Week 6 serum metabolomic profiles differed, based on qualitatively different heatmaps (supplementary Figure S2), and non-overlapping 95% confidence ellipses in OPLS-DA analysis accounting for time as a factor. The Week 1 and Week 6 profiles did not differ significantly in unsupervised PCA analysis, which does not account for clustering by time. The PCA score plots separated the serum metabolomic profiles of two participants in Week 1 from all other profiles (supplementary Figure S3).
Of the 168 known compounds detected in serum, 86 increased or decreased by 2-fold or more for three or more participants. Pathway analysis of the 86 known compounds identified over two dozen pathways potentially impacted by the 2-fold changes. Tables 2-4 list the known compounds that changed by 2-fold or more by potentially impacted pathway. Supplementary Table S2 lists the log fold change of each known compound. Supplementary Table S3 lists impact factors and p-values for each metabolic pathway.
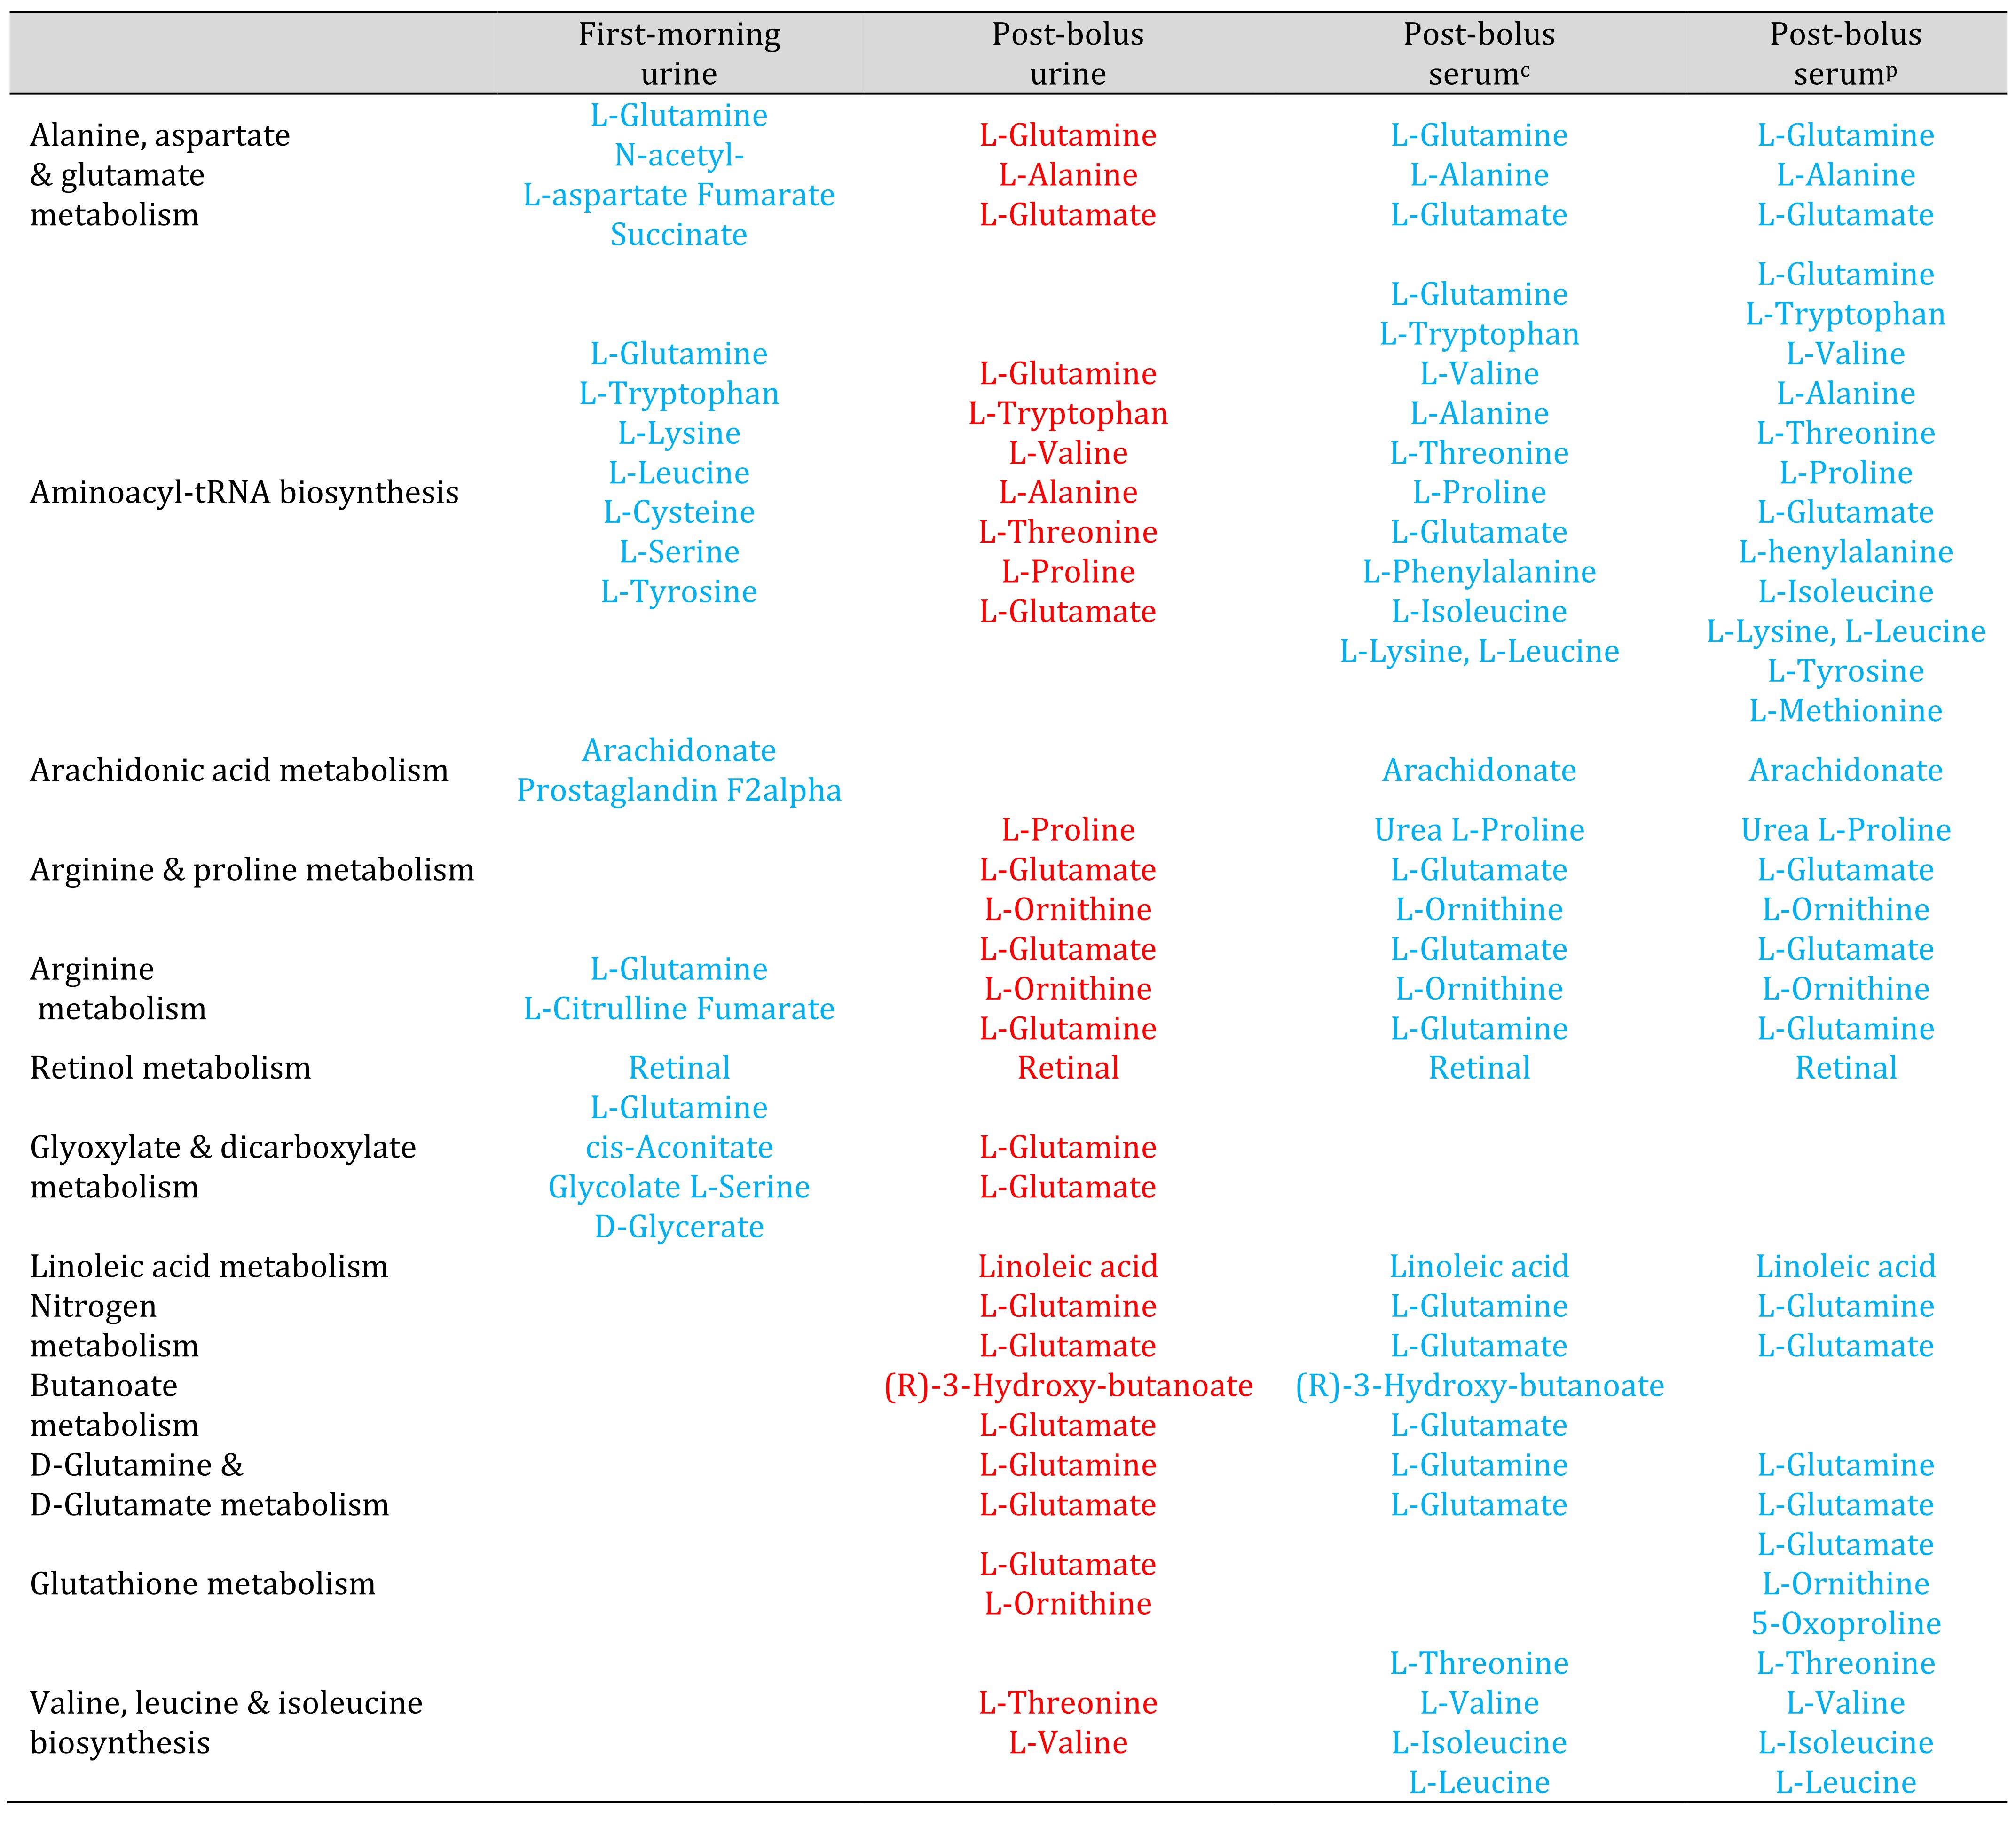
Table 2. Metabolic pathways that appeared decreased in serum and increased in post-bolus urine. Red and blue font highlight known compounds that changed by 2-fold or more between Week 1 and Week 6. Red font represents compounds that increased. Blue font represents compounds that decreased. Urine results are based on analyses that normalized urine feature abundance relative to creatinine. c Serum results based on analyses that normalized serum feature abundance relative to creatinine. p Serum results based on analyses that normalized serum feature abundance relative to the pooled Week 1 sample.
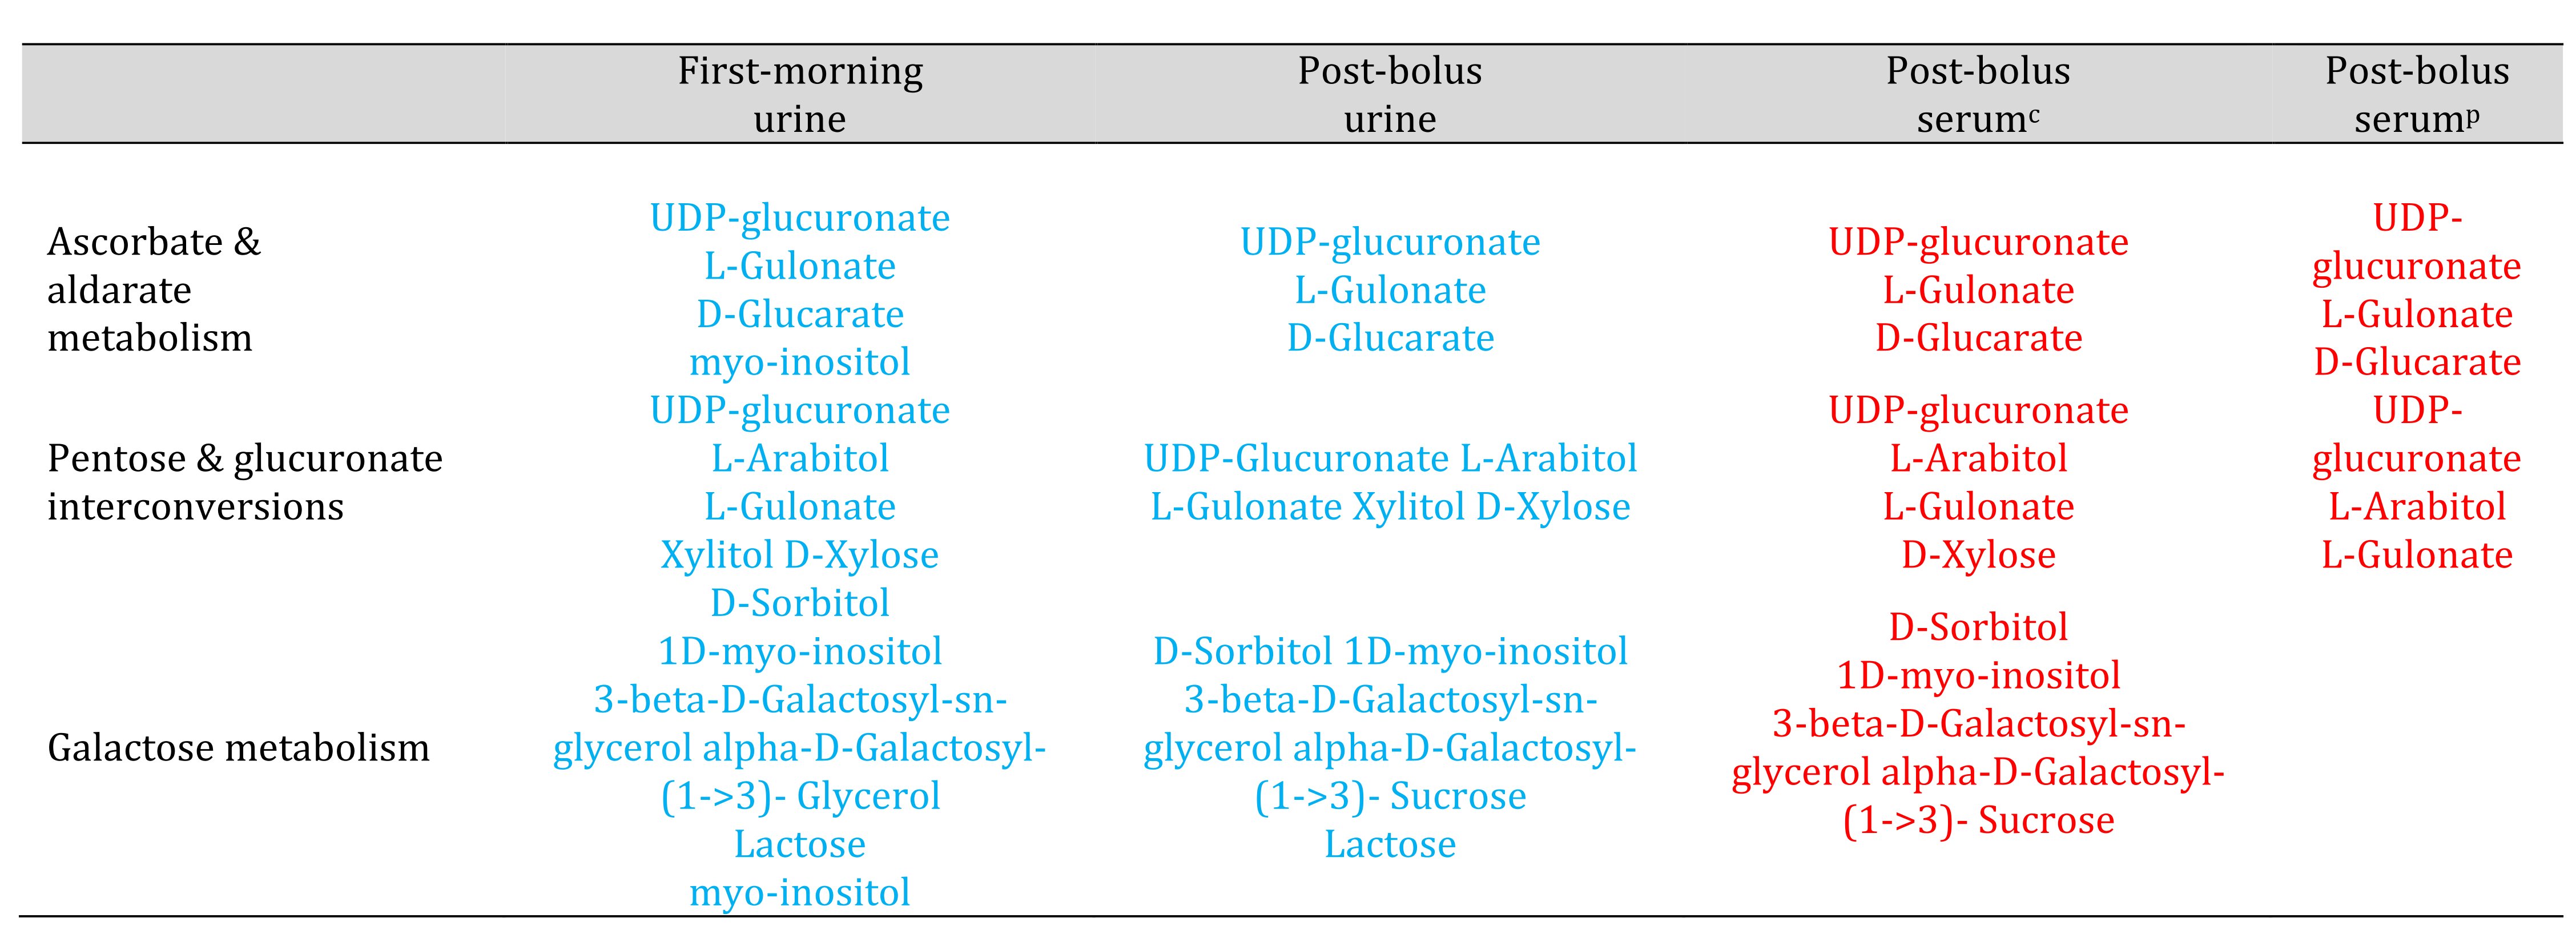
Table 3. Metabolic pathways that appeared increased in serum and decreased in urine. Red and blue font highlight known compounds that changed by 2-fold or more between Week 1 and Week 6. Red font represents compounds that increased. Blue font represents compounds that decreased. Urine results are based on analyses that normalized urine feature abundance relative to creatinine. c Serum results based on analyses that normalized serum feature abundance relative to creatinine. p Serum results based on analyses that normalized serum feature abundance relative to the pooled Week 1 sample.
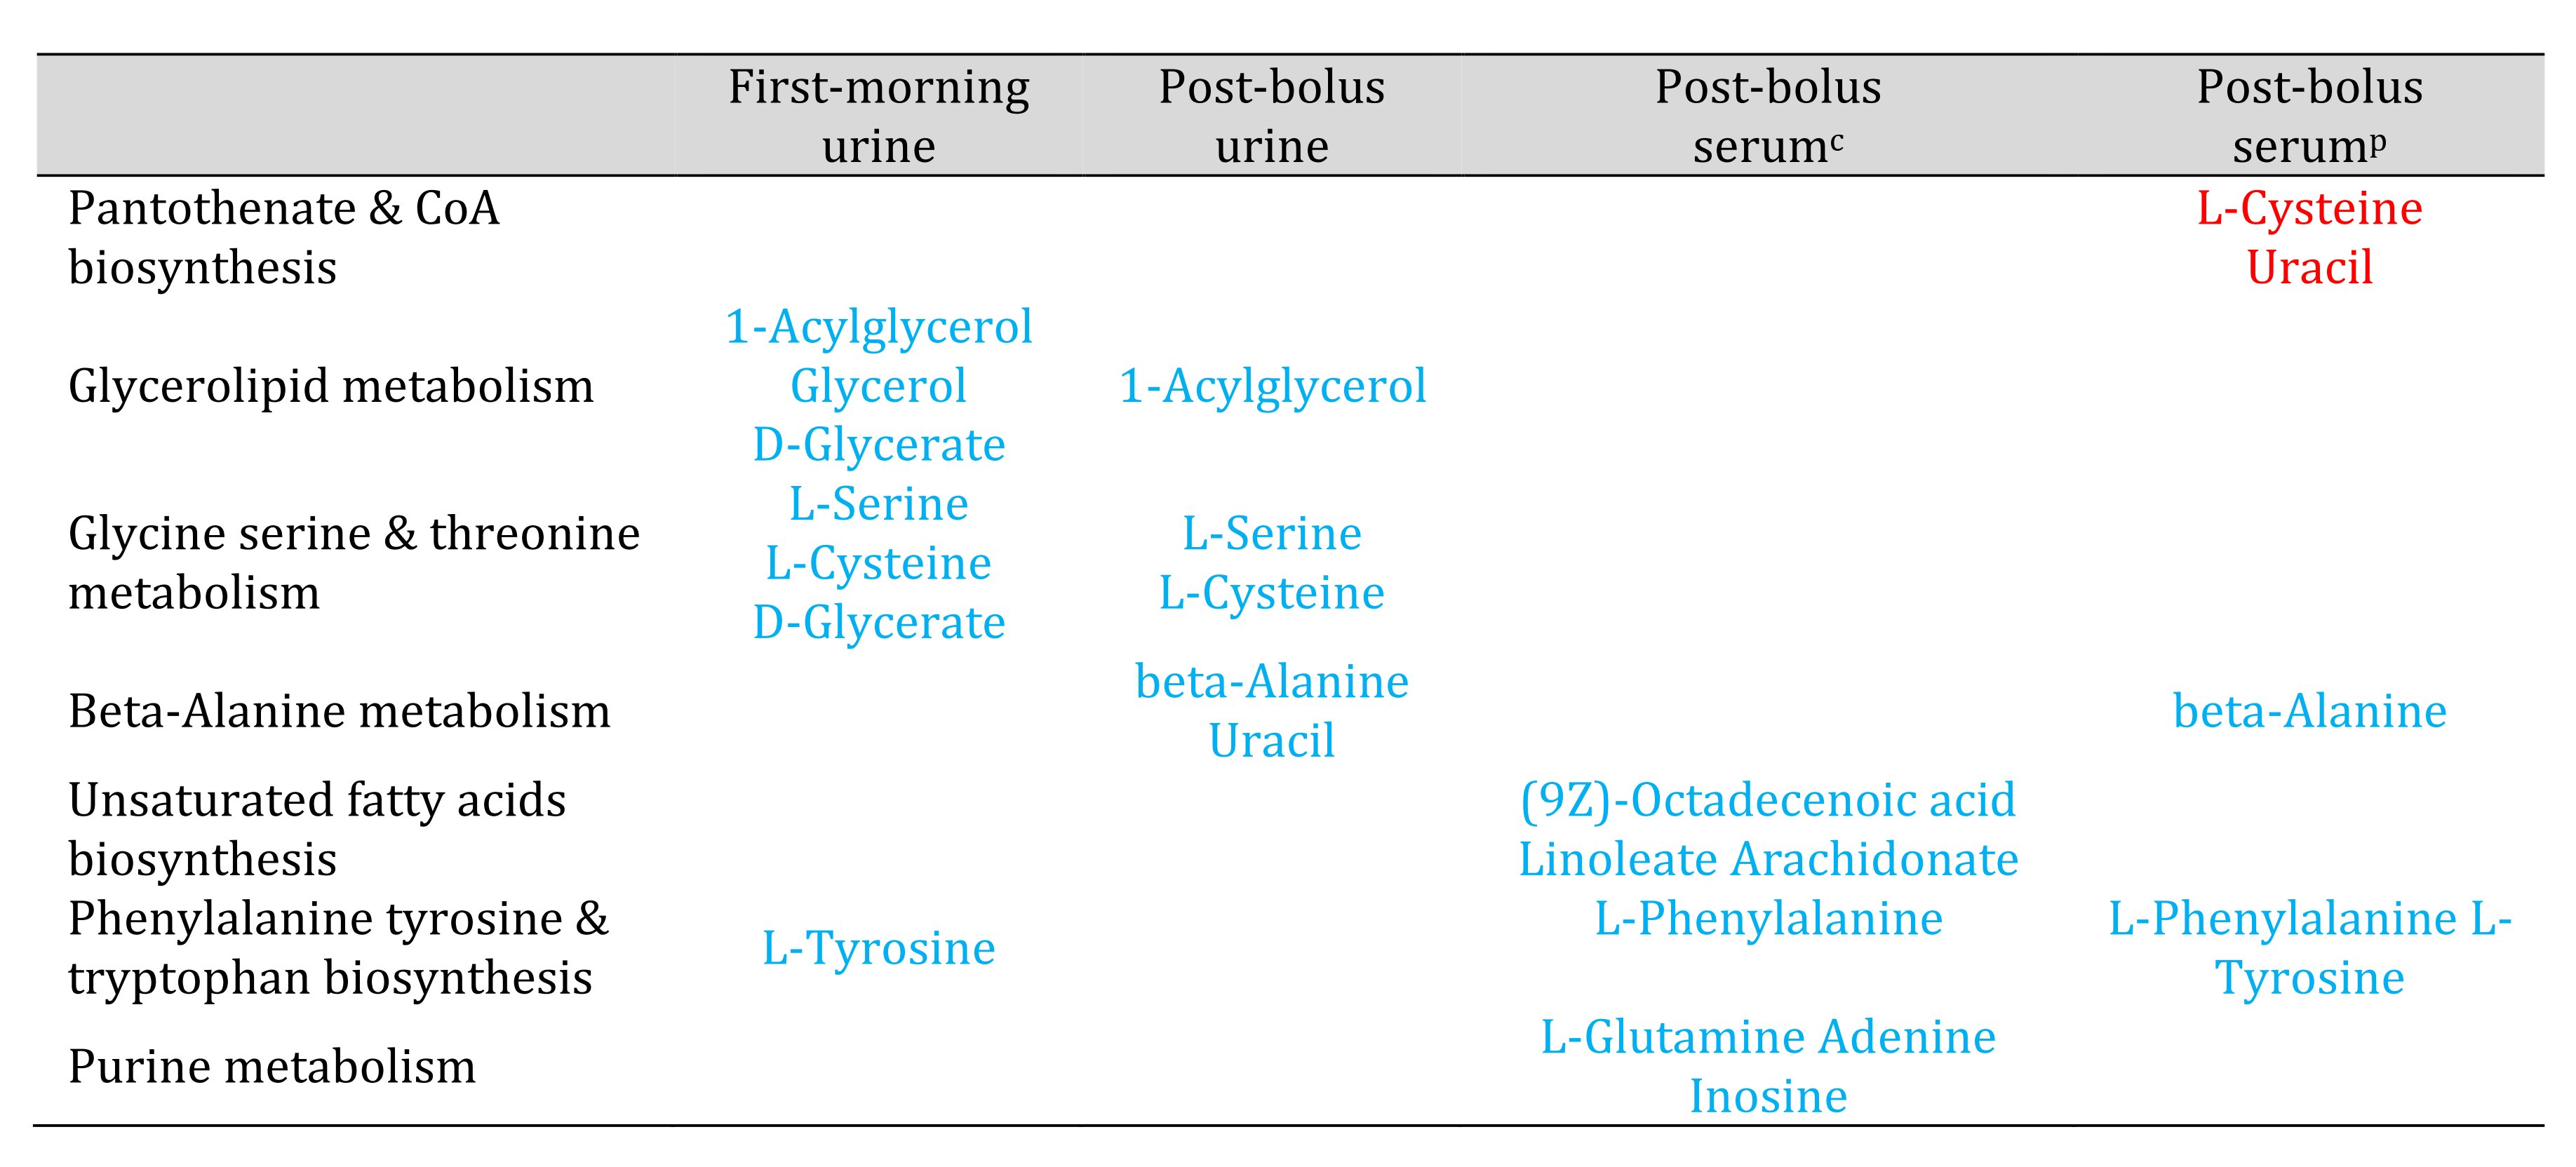
Table 4. Metabolic pathways that appeared potentially impacted in urine or serum but not both specimen types. Red and blue font highlight known compounds that changed by 2-fold or more between Week 1 and Week 6. Red font represents compounds that increased. Blue font represents compounds that decreased. Urine results are based on analyses that normalized urine feature abundance relative to creatinine. c Serum results based on analyses that normalized serum feature abundance relative to creatinine. p Serum results based on analyses that normalized serum feature abundance relative to the pooled Week 1 sample.
Specific Aim 2: Check for a switch in macronutrient and energy metabolism, redox balance, and inflammation
Figure 1 summarizes all of the pathways identified as potentially impacted. Pathways where the intermediate(s) decreased (blue font) were distinguished from those where the intermediate(s) increased (red font).
Pathways identified as potentially impacted include pathways involved in macronutrient and energy metabolism, redox balance, and inflammation. Collectively, the pathway analyses suggest concurrent changes in metabolism away from protein degradation, favoring oxidation of carbohydrate in the TCA cycle instead of glucose metabolism to lactate.
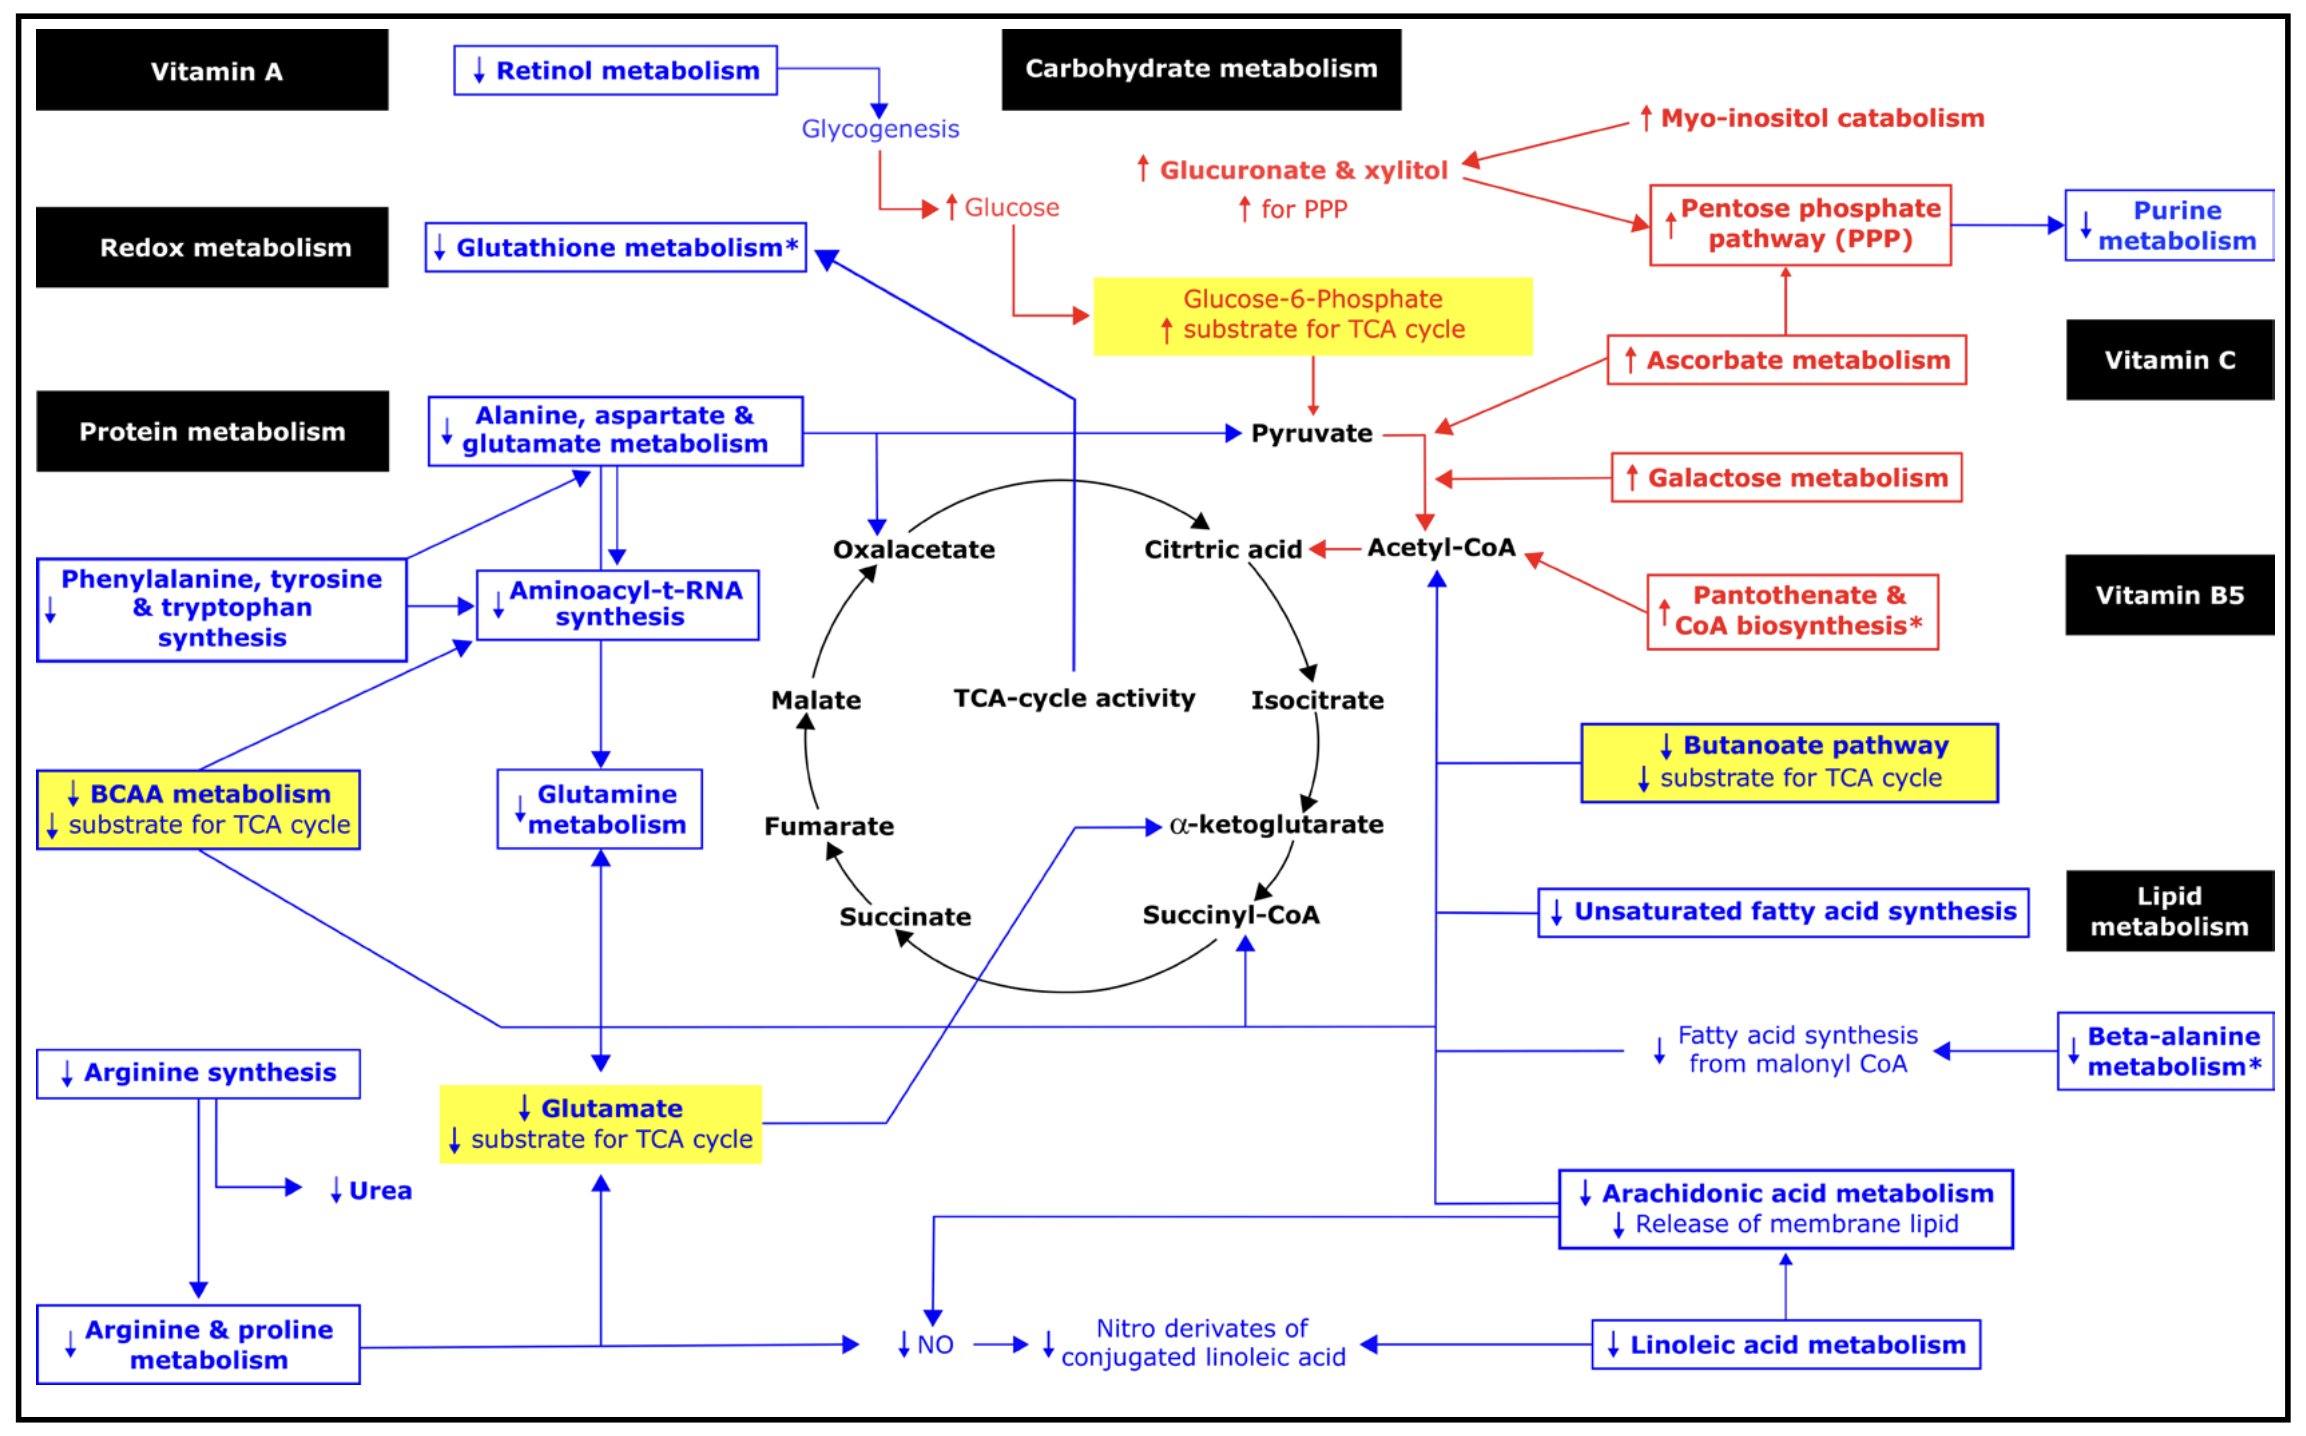
Figure 1. Metabolic pathways potentially impacted by the induced change in chronic hydration based on changes in serum metabolomic profile between Week 1 and Week 6. Pathway impact was analyzed for known compounds that changed by 2-fold or more in serum. Metabolomic pathways identified only in serum when normalized relative to the pooled Week 1 samples are marked with an asterisk (*). Bold font denotes 2-fold or greater change observed in this analysis. Red and blue font represent 2-fold or greater increases and decreases between Week 1 and Week 6, respectively. Metabolic pathways potentially impacted are shown enclosed in a box. Metabolic intermediates that changed are shown without a box. Hypothesized correlated changes, which might be inferred but were not observed in this analysis, are shown without bold font. Example sources of substrate for the TCA cycle are highlighted in yellow. See Table 3 for detail about metabolic pathways potentially impacted.
Protein metabolismObserved changes in the serum abundance of amino acids implied decreased amino acid-derived carbons for the TCA cycle, including pyruvate, oxaloacetate, succinyl-CoA, and α-ketoglutarate:
Carbohydrate metabolismChanges in the serum abundance of carbohydrates, such as UDP-glucuronate, favored oxidation of glucose in the TCA cycle:
Purine metabolismObserved decreases in serum L-glutamine, adenine and inosine implied reduced purinesynthesis and/or degradation:
Lipid metabolismChanges in the serum lipid abundance indicated decreased reliance on ketone body and fatty acid precursors for the TCA cycle, consistent with increased glucose utilization:
Redox balance & inflammationIncreased serum abundance of vitamin C suggested potential impact on redox balance.
Specific Aim 3: Check for agreement between specimen types This study analyzed two kinds of specimen (serum and urine), which were collected under two kinds of conditions (first-morning and following hypotonic challenge) and normalized with two kinds of methods (relative to creatinine or relative to the pooled Week 1 sample). The following results were similar across all specimen types, conditions, and normalization methods:
Of the 20 pathways that appeared impacted based on serum analyses, 17 also appeared impacted in urine analyses (see Tables 2, 3 and S3). Results of the heatmap, OPLS-DA and PCA analyses of each specimen type are detailed in the Supplementary Materials (see Figures S1-S3).
Differences between urine and serum
Unlike the OPLS-DA results for the serum data, the OPLS-DA results for the urine data suggested reduced between-person variation in the urine metabolomic profile in Week 6 (supplementary Figure S3). Potential impacts on glycine, serine and threonine metabolism, glyoxylate and dicarboxylate metabolism, and glycerolipid metabolism were only detected in urine. The pantothenate & CoA biosynthesis, glutathione metabolism, and purine pathways were not identified as potentially impacted based on urine (Tables 2-4).
The urine and serum metabolomic results differed in terms of directions of effect. The majority of low molecular weight features increased in abundance relative to creatinine, in serum, but decreased relative to creatinine, in urine (Table 3). The ascorbate & aldarate, pentose & glucuronate, and galactose pathways, which appeared upregulated based on the serum metabolomic profile, appeared downregulated based on the urine metabolomic profiles. Metabolic pathways which appeared increased in post-bolus urine (Table 2), appeared to decrease in the other specimen types: Alanine, aspartate & glutamate metabolism, aminoacyl-tRNA biosynthesis, arachidonic acid metabolism, arginine & proline metabolism, arginine biosynthesis, retinol metabolism, and glyoxylate & dicarboxylate metabolism.
Differences by timing and normalization method
Many features which decreased in abundance in the first-morning urine from Week 1 to Week 6 increased in abundance in the post-bolus urine (see Table 2). The acute change in condition, from overnight food and water restriction to 60 min post-ingestion of 750 mL drinking water, was associated with a reversal in the direction of potential impact of the chronic hydration exposure on alanine, aspartate, glutamate and glyoxylate metabolism and arginine and aminoacyl-tRNA synthesis.
Most of the metabolic pathways (12 out of 14) that were identified as potentially impacted based on the serum results, when normalized by creatinine, also appeared potentially impacted when normalized by the pooled Week 1 sample. The two exceptions, butanoate and galactose pathways, did not appear impacted when normalization did not account for hemodilution. Normalization by the pooled sample, which might better reflect the in vivo or physiological condition, identified three pathways, which were not identified by normalization by creatinine. Potential impacts on glutathione and beta-alanine metabolism and pantothenate & CoA biosynthesis were observed without correction for hemodilution.
Inspired by experimental literature indicating that chronic hypotonicity results in a “major alteration” in metabolism at the cell level [11, 15], this clinical study sought to check if chronic hypotonicity is associated with a broad array of metabolic changes at the whole person level. The study took advantage of frozen specimen collected from healthy young men for the Adapt Study, before and after a chronic hypotonic exposure, induced by four weeks of sustained higher intake of drinking water. This paper reports results of ancillary urine and serum metabolomic analyses.
The present study population experienced four weeks of physiologically relevant hypotonicity, at the cell level, based on significantly decreased plasma copeptin and urine osmolality in Weeks 3-6 vs. Week 1. Plasma copeptin is a proxy for ADH because it is released in equimolar amounts with ADH [130]. Hypotonic swelling of osmoreceptor cells in the hypothalamus inhibits ADH release and urine concentration [131].
Significantly altered acute response to hypotonic challenge in Week 6 vs. Week 1 suggests adaptation to chronic hypotonicity in this study population. Significant decreases in RBC K:Na (altered intracellular osmolytes) co-occurred with significant increases in cell water (as indexed by MCV) and increased body water (as indexed by percent change in body weight), despite significantly faster water turnover and decreased effort to retain body water via urine concentration.
Check for a major alteration in metabolism
Consistent with results from controlled experiments at the cell level [11, 15], chronic hypotonicity did appear to be associated with a major alteration in metabolism in the present study. In absolute terms, hundreds of metabolic features increased or decreased in abundance by 2-fold or more. In relative terms, over half of the known and unknown features detected in serum changed by 2-fold or more. The overall metabolic profile changed significantly based on OPLS-DA. Over two dozen metabolic pathways were potentially impacted.
Check for a switch in macronutrient and energy metabolism, redox balance, and inflammation
Results of the present study indicated a switch in metabolism away from an aestivation-like pattern. Aestivation is characterized by protein breakdown and accumulation of organic osmolytes, including urea [4, 5, 7, 9]. At the cell level, adaptation to chronic hypotonicity switches metabolism by downregulating protein breakdown and metabolic pathways that accumulate intracellular products of low molecular weight [41]. In the present study, protein-breakdown and urea metabolism decreased between Week 1 and Week 6, consistent with experimental literature at the cell level.
The present results are also consistent with a switch away from a Warburg-like pattern, to favor oxidation of carbohydrate via the TCA cycle instead of aerobic oxidation of carbohydrate to produce lactate. Between Week 1 and Week 6, protein-derived precursors for the TCA cycle decreased, while carbohydrate-derived precursors increased. Serum lactic acid decreased by 87% (supplementary Table S2 gives values as log-fold changes). Fasting serum glucose and the fasting whole body respiratory quotient increased significantly (see supplementary Table S1), despite no change in the mean weekly total energy and carbohydrate intake and no apparent decrease in insulin sensitivity. Fasting plasma insulin and the HOMA index of insulin resistance trended down from Week 1 to Week 6.
Consistent with experimental data [67], the chronic hypotonic exposure was associated with potential impacts on the pentose phosphate pathway. The pentose phosphate pathway produces glucose-6-phosphate, which in turn can either be used for glycolysis or recycled through the pentose phosphate pathway [132, 133]. Flux of glucuronate and xylitol through the pentose phosphate pathways favors oxidation of glucose via glycolysis. The pentose phosphate pathway increases ascorbic acid recycling [134].
Concurrent changes in vitamin C, retinoic acid, proline abundance, and galactose metabolism suggested coordinated impact on oxidative glycolysis. Vitamin C boosts the conversion of pyruvate into acetyl CoA within the mitochondria by inhibiting pyruvate dehydrogenase kinase-1 (PDK-1), a key mitochondrial enzyme that redirects glucose metabolism from oxidative phosphorylation toward aerobic glycolysis [135]. Under fasting conditions, lower retinoic acid may contribute to metabolic flexibility [136-138]. Decreased retinol metabolism increases glucose availability by decreasing glycogen synthesis from acetate, lactate, and glycerol. Reduced proline abundance decreases net glycogen deposition because proline simultaneously increases glycogen synthase flux and inhibits phosphorylase flux [139]. Increased galactose metabolism favors mitochondrial oxidative glycolysis [140].
The Warburg effect is characterized by increased production of lactate because of changes that include inhibition of the pyruvate dehydrogenase complex by pyruvate dehydrogenase kinases and high expression of NF-κB [93]. The Warburg effect is also characterized by increased purine metabolism, as glycolytic intermediates (3-phosphoglycerate and fructose-6-phosphate) are routed to the non-oxidative branch of the pentose phosphate pathway, which generates ribose-5-phosphate, substrate for purine metabolism. The Warburg effect is associated with low ATP concentrations [141], which in turn can reflect low phosphate levels [142]. In the present study, purine metabolism was decreased in Week 6 vs. Week 1. Serum phosphate increased by 20% relative to creatinine between Week 1 and Week 6.
The switch favoring oxidative glycolysis, in this study, appeared to co-occur with a switch in dominant antioxidants with no adverse effect on inflammation. As vitamin C and TCA cycle metabolism increased, glutathione, arginine, linoleic acid and beta-alanine metabolism decreased. Vitamin C is considered the most effective aqueous-phase antioxidant in human blood plasma, which unlike other plasma antioxidants, completely protects plasma lipids against detectable peroxidative damage induced by aqueous peroxyl radicals [143]. Higher TCA cycle activity causes an increase in TCA cycle acids, which are antioxidants [144]. Glutathione, nitric oxide produced from arginine, and conjugated linoleic acid isomers, though important antioxidants [145-147], may be less compatible with sustained hypotonic conditions where protein and lipid breakdown are reduced, nitric oxide-mediated vasodilation is less needed, and NF-κB-dependent cytokine expression [148, 149] is downregulated by hypotonic conditions [150, 151]. Reduced breakdown of the dipeptides anserine and carnosine to beta-alanine favors anserine and carnosine antioxidant capacity. The observed decreases in arachidonic acid metabolism, which imply decreased inflammation [152], suggest no loss of antioxidant protection from the decrease in glutathione, arginine, and linoleic acid metabolism.
The coordinated metabolomic changes may have been at least partially mediated by chronic effects on gene transcription, given that synthesis of aminoacyl-tRNA decreased. Decreases in aminoacyl-tRNA synthesis decrease substrate for acylation-mediated glucose sensing, signaling and transcription which determine glucose uptake, energy utilization and de novo lipogenesis [153].
Check for agreement between specimen types
General agreement between specimen types, with respect to potential impacts on macronutrient and energy metabolism, suggests that any of the four specimen types might reasonably be used to check for hydration effects on metabolomic profile (impact vs. no impact). Inference regarding specific pathways or directions of effect appeared to depend on specimen type and condition, however.
Many low molecular weight features increased in serum, relative to creatinine, possibly reflecting counterregulatory accumulation of osmolytes to gradually retain water and increase the total body water pool. In the Adapt Study participants, the induced change in hydration was associated with significant decreases in RBC K:Na and increases in plasma aldosterone, serum sodium, RBC volume, and body weight [96, 97].
In contrast to observed increased abundance in serum, the majority of low molecular weight features decreased in abundance in post-bolus urine. Between-person differences in metabolomic profile also decreased. The decreases in urine feature abundance, relative to creatinine, may be consistent with chronic relative hypotonicity limiting the intracellular accumulation of low molecular weight osmolytes and reducing the efflux of osmolytes following an acute hypoosmotic challenge. Homeostatic mechanisms that prevent serum concentrations from varying outside a narrow range might account for the different response in urine compared to serum.
Opposite directions of potential pathway impact in serum and urine metabolomic studies are attributed to homeostatic regulation and local tissue effects [154]. The serum metabolomic profile or metabolic ‘fingerprint’ is known to be distinct from the metabolic ‘footprint’ observable in urine [107]. While serum may reflect whole body metabolism, urine is thought to mainly reflect the renal cellular and functional processes and state of the kidney [107]. Opposite effects on serum and urine metabolomic profiles may not be inconsistent effects if increased renal excretion contributes to or explains decreased serum abundance.
In general, the abundance of a given free metabolite in serum or urine is determined by the net balance of its appearance in (by production, influx and/or release from sequestration) and disappearance from (by conversion, efflux, and/or sequestration) the fluid. In serum the abundance of glutamine, for example, is determined by its release from cells (e.g. from skeletal muscle, liver, brain, lung, gut, adipose tissue), by its uptake into cells (e.g. kidney, small intestine, liver, endothelia, blood cells, immune cells, cancer cells), by paracellular exchange between compartments (e.g. blood/gut, blood/peritoneal cavity, across blood brain barrier) and by its direct loss viaurine which is determined by its glomerular filtration and tubular reabsorption [155-157].
Contributions from the various inputs to the net glutamine balance may change considerably during adaptation to altered conditions [158]. Here, glutamine abundance decreased in first-morning urine and post-bolus serum but increased in post-bolus urine when compared Week 6 to Week 1. The decrease in first-morning urine could reflect decreased glutamine in plasma and hence less glutamine filtered by the kidney and/or increased tubular reabsorption of glutamine. A decrease in serum glutamine concentration would be consistent with a net shift of glutamine to protein synthesizing tissues like liver or skeletal muscle, increased synthesis of glutathione, or decreased urea production. As plasma protein and albumin decreased from Week 1 to Week 6, the data suggest increased protein synthesis in skeletal muscle. Also BUN and BUN:creatinine trended to decrease. The decreased serum glutamine might also be explained by enhanced gluconeogenesis from glutamine.
Opposite directions of potential impact in the urine metabolome, before and after hypotonic challenge, may be useful for distinguishing chronic from acute effects of hypotonicity and generating hypotheses about mechanisms of adaptation. The agreement in direction of potential impact, i.e. the null effect of the acute challenge, on the ascorbate, pentose and glucuronate interconversions, galactose, glycerolipid, and glycine pathways suggests chronic or regulated change in these pathways.
Potential implications for chronic disease and aging
The results of this study imply potential for hydration metabolomic profiles to be inversely associated with aging and risk for chronic diseases, including obesity, diabetes, atherosclerosis, and cancer [152]. The DunedinPACE index, a DNA methylation marker of the pace of aging, decreased significantly. The metabolomic patterns shifted away from aestivation-like and Warburg-like profiles. Aestivation-related metabolism, including elevated BCAA and urea cycle metabolites, is associated with increased risk of insulin resistance, obesity, hypertension, dyslipidemia and coronary artery disease [84, 85, 87, 90, 159]. The Warburg metabolic profile is implicated in inflammation and the pathogenesis of cancer and atherosclerosis [152].
Alignment of the present results in free-living young men with experimental data at the cell level suggests causal mechanisms to explain observational effects of sustained higher intake of drinking water on chronic disease and mortality. The present results imply that sustained hypotonic exposure may reduce chronic disease risk via multiple mechanisms, simultaneously, including NF-κB signaling and gene transcription, redox balance, and Renin–Angiotensin–Aldosterone System (RAAS) activation.
Between Week 1 and Week 6, concurrent with decreases in extracellular osmolality, leukocyte SGK1 mRNA decreased (see [96, 160]).Hyperosmotic stress, SGK1 and retinoic acid trigger the NF-κB signaling cascade and gene transcription [150, 151]. SGK1 accounts for a large part of the pathophysiological consequences of dehydration [161, 162]. Retinoic acid, via NF-κB signaling, affects transcription of over 500 genes involved in cell proliferation, differentiation, and apoptosis [163].
The observed increase in serum abundance of vitamin C and decrease in arachidonic metabolism are consistent with reduced oxidative stress and inflammation. Vitamin C is hypothesized to prevent or delay the development of certain cancers, cardiovascular disease, and neurodegenerative diseases [164] by limiting the damaging effects of free radicals through its antioxidant activity. The arachidonic acid pathways are implicated in obesity, diabetes, CVD, cancer and inflammatory diseases including asthma and arthritis [165, 166].
The present results carry implications for clinical and epidemiological research. If hydration causes major alteration in the whole metabolic profile, focus on one hydration effect at a time may miss meaningful correlated variation. Single hydration effects may be confounded or modified by other aspects of the profile. The ‘optimal’ hydration reference group may be misclassified if individuals respond to or compensate for sub-optimal hydration differently. Acute and chronic effects of hydration may interact.
Inconsistent findings across studies
Results of the present analysis conflict with earlier Adapt Study analyses to some extent. In the present analysis, BCAA abundance appeared to decrease between Week 1 and Week 6 (based on pathway impact p-value <0.001 and FDR <0.001), whereas in earlier analyses [96], mean plasma amino acid concentrations did not change significantly between these time points. The difference in findings may be attributable to the fact that earlier analyses evaluate the effect of time (e.g. Week 6 vs. Week 1) as opposed to the effect of different hydration conditions. The earlier analysis included all Adapt Study participants, unlike the present one, which included only participants who experienced a measured change in hydration classification. Significant between-participant differences in saliva osmolality, deuterium elimination rate, and change in serum sodium signal heterogeneity at baseline, which may have modified effects of the hydration exposure [97].
Apparent decreases in protein catabolism associated with four weeks of sustained hypotonic water intake in the present analysis are consistent with previously reported significant decreases in whole body protein breakdown associated with experimentally induced acute hypoosmolality vs. isoosmolality [94]. The observed prioritization of glucose as substrate for the TCA cycle in this long-term study needs to be reconciled, however, with a reported decrease in glucose clearance and increase in lipid oxidation associated with acute hypotonic exposure [94]. Also, unlike previous short-term experiments, but like other metabolomic analyses, this metabolic pathway analysis did not detect change in glycogen synthesis or breakdown [167]. LC-MS methods may not accurately index glycogen because they cannot distinguish hexoses with the same molecular formula [167].
Features observed in other Adapt Study analyses of serum and urine, including sodium, potassium, vitamin D, and taurine, were not detected by the WCMC and not available in the metabolomic analysis dataset. Absence of their mention in the present analysis may reflect WCMC methods, which are tailored to describe primary metabolism, such as protocol that removes features considered to contribute noise, like sodium, or limitations related to ionization voltage so high that molecules like taurine fragment into multiple products [168, 169].
Methods limitations
Several aspects of study design limit interpretation of the present results. Aspects of primary metabolism were described only for the four study participants included in this analysis, given the conditions specified in the Adapt protocol. Participants were non-acutely ill, free-living, sedentary, young men, who consumed the same foods on a weekly basis, and who initially reported less than 2 L/d total water intake [96, 97]. Due to the small sample size and non-random recruitment strategy, the results may not generalize to non-acutely ill, sedentary young men, in general. The results may not generalize to women, children, older adults, athletes, patients, or the general population. It remains to be determined if instruction to consume an additional 2 L/d or 30 mL/kg/d plain drinking water results in a similar switch in metabolism in other population groups, under other conditions.
Despite intention to enroll participants with similar sub-optimal hydration status, the ‘true’ long-term hydration status of each participant at baseline was unknown. Urine osmolality is sensitive to acute change in hydration but vulnerable to misclassification error with respect to chronic status. Results of the unsupervised PCA, which separated the data for two participants from all other data points, suggest that two participants had different hydration status at baseline.
Despite intention to test a homogeneous exposure, each individual’s ‘true’ water intake requirement was unknown. The Adapt Study exposure was expressed in absolute terms (L/d above baseline) as opposed to mL/kg or a tailored volume to replace individual-specific deficit. The fact that at least one Adapt study participant did not change hydration classification suggests heterogeneity in the dose, timing and/or conditions required to achieve the same hydration outcome for all.
The effects of the present study may be confounded by unobserved variability in protocol adherence, diet, physical activity and/or other determinants of water intake requirements. Although each participant served as his own control, the study design was not randomized. Although participants were instructed to maintain the same diet over time, without researcher-provided meals, standardized diet cannot be guaranteed. Controlled diet experiments would be needed to confirm and characterize independent effects of water on changes in metabolism.
Due to the small sample size, analyses had limited statistical power to test for significant change over time or pathway impact, accounting for multiple comparisons. The pathway analyses considered metabolite abundance measured at two points in time, as opposed to metabolic ‘flux’, and were observational, not causal, analyses. It is not possible to distinguish reduced pathway inputs from reduced pathway activity. Decreased purine metabolism, for example, may reflect reduced purine synthesis and/or reduced purine catabolism. Analyses did not consider change in cell membrane composition and function, water/nutrient transporters, tissue-specific effects, or features not detectable by ALEX-CIS GCTOF mass spectrometry.
Potential measurement error limits interpretation of the results. MCV and percent weight change were the only available indices of cell volume and total body water volume in the Adapt Study database. Future studies should include measures of intracellular fluid volume and total body water along with measures of glycogen utilization and gluconeogenesis. As noted above, the present metabolomic results reflect protocol which cannot detect all metabolites and algorithms which may misclassify metabolites as noise.
Feature abundance was normalized by creatinine in this study to reduce intraindividual variation [170, 171] as well as account for known decreases in serum and urine osmolality [96, 97]. Normalization by creatinine can introduce error, however, if the rate of creatinine production is not constant. Creatinine production can differ between individuals if people vary in age, sex, and body size, and can differ within-individuals if there are changes in renal function, metabolism or muscle mass [172, 173]. Study participants ranged in weight from 62.1-69.7 kg. If protein metabolism changed significantly between Week 1 and Week 6, in relation to the induced change in hydration, then assumptions required to normalize the outcome of interest by creatinine may not hold. The similar pattern of results observed when normalizing relative to the pooled Week 1 samples suggest that this source of error was negligible.
This analysis described healthy young men before and after four weeks of sustained higher intake of drinking water. It juxtaposed acute and chronic effects of hypoosmotic challenge. Despite the small sample size and non-randomized design, the detailed descriptive data support hypothesis generation and warrant further research.
The results suggest the hypothesis that, for sedentary healthy young men, >1 L/d additional drinking water can lead to measurable changes in hydration at the cell and whole-body levels, if sustained for four weeks. The results suggest the hypothesis that sustained lower extracellular osmolality downregulates metabolic pathways that alter macronutrient and energy metabolism to accumulate end-products of low molecular weight, including sorbitol, lactose, glycerol, and free amino acids, in healthy, young adult men. The results suggest that chronic cell hydration acts as a metabolic switch, which alters many metabolic pathways in concert, at the whole-person level. The types of metabolic pathways identified as potentially impacted by this analysis as well as the observed direction of potential pathway impact are consistent with experimental literature at the cell level. Finally, the results warrant further work to determine if sustained higher intake of plain drinking water shifts metabolism away from aestivation-like and Warburg-like patterns, and limits multiple chronic disease risk factors, simultaneously.
ALEX-CIS GCTOF MS (automated liner exchange, cold injection system, gas chromatography with time-of-flight mass spectrometry); BCAA (branched chain amino acid); BLRM (bovine liver reference material); BUN (blood urea nitrogen); CKD-EPI (Chronic Kidney Disease Epidemiology Collaboration); CHORI (Children’s Hospital Oakland Research Institute); CKD (chronic kidney disease); CoA (coenzyme A); CV (coefficient of variations); CBC (complete blood count); DunedinPACE (Dunedin Pace of Aging Calculated from the Epigenome); FDR (False Discovery Rate); HCT (hematocrit); HOMA-IR (Homeostasis Model Assessment Index of Insulin Resistance); IL (interleukin); ICP-AES (inductively coupled plasma atomic emission spectroscopy); KEGG (Kyoto Encyclopedia of Genes and Genomes); LC-MS (liquid chromatography–mass spectrometry); MCV (mean corpuscular volume); NIST (National Institute of Standards and Technology); NFAT5 (Nuclear factor of activated T cells 5); NF-κB (nuclear factor-kappa B); Nrf2 (nuclear factor-E2-p45-related factor2); OPLS-DA (Orthogonal Partial Least Squares Discriminant Analysis); PCA (Principal Component Analysis); RBC (red blood cell); SGK1 (serum & glucocorticoid inducible kinase); TCA (tricarboxylic acid); TNF (tumor necrosis factor); TonEBP (tonicity-responsive-enhancer-binding-protein); WCMC (West Coast Metabolomics Center);
Thank you to Janice Hamer, Christine Chi, Annie Higa and Vivian Ng for sample collection and processing, Sandra Larkin for Advia hematology analyses and ektacyometry, and Kathryn Gallagher and J.J. Fung for sample preparation for the WCMC. Thank you to the Reviewers for helpful comments.
Funding
Data collection for the original Adapt study was provided by an unrestricted grant from Danone Research in 2007, NIH CTSA grant UL1 RR024131, and NIH RAS Award ID No. A106017. The sample preparation and metabolomic assays at WCMC were paid for by JDS. The data analysis and manuscript preparation were unfunded.
Author contributions
JDS was responsible for all aspects of the project, including design and implementation of the research, data analysis, manuscript preparation, and primary responsibility for the final content. BP, TKF, FL, DH and MR provided essential expertise in data interpretation and supported manuscript preparation. Supervision, JDS and MR; Validation, JDS, MR, FL, DWK, FAK and DH; Visualization, JDS and MR; Writing and editing, JDS, and MR. All authors have read and approved the final manuscript.
Statement of Ethics
This research was conducted ethically in accordance with the World Medical Association Declaration of Helsinki (https://www.wma.net/policies-post/wma-declaration-of-helsinki-ethical-principles-for-medical-research-involving-human-subjects/). The protocol was reviewed and approved by the Institutional Review Board of Children’s Hospital & Research Center Oakland, CA. All participants gave written informed consent.
The authors have no conflicts to disclose.